

What Do Standardized Tests Actually Measure?
Looking at the testing data in Arkansas to find the answer


Allow me to set the stage before I answer the question posed in the title of this article. The stage is important because it is what led me down the rabbit hole to find the answer.
Marvell-Elaine School District is taken over by the state
The small, rural Marvell-Elaine School District has received a lot of media attention during this past year. The two communities are part of impoverished South Arkansas with a history of forced consolidations during the time of former governor, Mike Huckabee, the father of current Governor Sarah Huckabee Sanders. Due to decreasing enrollment numbers and a failing school report card, the district was in danger of being consolidated again.
If you need more information surrounding what has happened in Marvell-Elaine over the past year, check out the news stories here. In short, the state took over the district, but agreed not to consolidate the district by allowing the district to enter a transformation contract with Friendship Education Foundation as part of the new LEARNS Act. There is a pending lawsuit challenging the emergency clause of the Act which made it law sooner than normal by declaring education in the state as an emergency. Read this article for more details about why there is a law suit challenging the emergency clause of the Act.
I will not dwell much longer on Marvell-Elaine, but I want to point out one more thing. The only reason the district was required to seek the transformation contract in the first place was that the state denied their waiver application to avoid consolidation based on them not meeting the 350 minimum enrollment, which Senate Bill 262 has since removed. However, at the time of the decision, the limit was still in place. If this same vote were to be taken in August once SB262 becomes law, they would likely not be in this situation.
Do schools and districts perform better after being taken over by the state?
After the news broke about the state taking control of the Marvell-Elaine School District, which removed their democratically elected school board and thus no longer under local control, I questioned the state’s record when it comes to taking over a district for low academic performance. Do these districts actually improve under state rule?
Luckily (or rather unluckily), this is not the first time the state took over a district in the state. Little Rock School District received a lot of national press when it was taken over in 2015 for poor test schools in several schools. It was not until six and one-half years later that the state relinquished its control of LRSD and returned it back to full local control in 2021.
The Arkansas Department of Education’s Data Center has all sorts of educational data available to the public. I used it to generate a custom report so I could examine the data. Since literacy data is primarily what the state uses to determine a school’s letter grade, I decided to also use the literacy scores at LRSD going back to 2015. I looked at the combined percentage of students from all grade levels who meet or exceed standards for literacy. I have shared the graph I generated from the data. I chose to break it down by different student populations too.
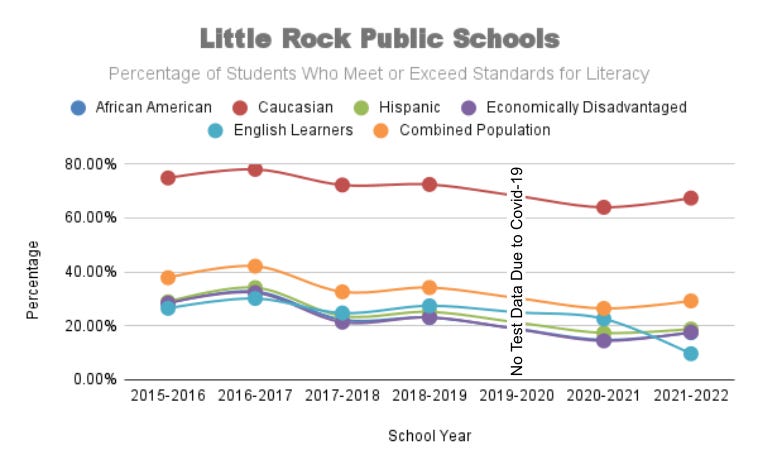
Update: I have been asked where the graph is for the African American students. It is virtually identical to the Economically Disadvantaged and indistinguishable in this view. Here is the data used to make this graph.
There are a few things I noticed about the data once I generated the graph. First, notice the general downward trend across all student populations. This trend existed before any learning loss due to Covid-19, but that certainly did not improve things. Second, the performance gap between Caucasian and other ethnic groups is quite stark. Caucasian students meet or exceed standards in literacy at a rate by 40-50%. Third, the groups all tend to change in lock-step with one another, with the exception of English learners during the last year I have data. Recall that the state took over LRSD in 2015 and control was returned in 2021. The takeover of LRSD coincided with charter schools expanding drastically in Little Rock.
Just using the eye test, it should be obvious that LRSD did not get better under state control between 2015-2021. There is a valid argument to be made that overall the district did not improve, at least when looking at overall literacy scores. The number of students who performed on grade level decreased by approximately 10-15% from the peak during that time period. Even if the loss due to Covid-19 is ignored, overall fewer students were performing at grade level after the state took control.
Did the scores decrease due to “brain drain”?
My curiosity got the best of me. I was not satisfied with just knowing that Little Rock Schools did not improve under state control. I had to dig deeper. Earlier I linked to an article that indicated charter schools in Little Rock saw massive growth during this time period. Given that scores decreased in LRSD, I thought that might mean students were leaving the traditional public schools and switching to charter and/or private schools. My initial thinking was that perhaps the smarter students were fleeing LRSD for greener pastures elsewhere. So I looked at student enrollment numbers over that time period.

I confirmed that enrollment numbers in LRSD decreased during that time. In fact, the population declined by approximately 3500 students. I noticed that most of the attrition was among black students though. The number of students in other populations remained mostly stable, but did the high-performing students really flee Little Rock Schools like I hypothesized?
Before I dove into the testing data for the charter schools, I wanted to verify that students were actually transferring from LRSD to charter schools throughout the city. It was also possible that there were just fewer students overall in Little Rock due to population decline of school-aged individuals.
I proceeded to check the enrollment numbers for the largest charter school systems in Little Rock, namely eStem Public Charter Schools, Lisa Academy, Founders Classical Academy - West Little Rock, and Exalt Academy of Southwest Little Rock. You can click on each graph below to see the full-sized version of each. All of them saw an increase in enrollment. So far my hypothesis seems to be on the right track.


Based on the changes in enrollment numbers between LRSD and the charter schools in the area, it does appear that students left the traditional public schools to attend charter schools. The math works out at least. Some could have also entered into private schools or switched to homeschooling, but I do not have data for those populations.
Here are some important observations about the enrollment numbers at these four charter schools:
eStem - Until 2017, about half of the students here were Caucasian. As enrollment increased, the proportions of their ethnic makeup are much more comparable to Little Rock.
Lisa Academy - Their fastest growing demographic, percentage-wise, is Hispanic/Latino. The percentages of their ethnic makeup are not reflective of Little Rock. I wonder what the reason for this difference is? (Note: I did not seek an answer for this question.)
Founders Classical Academy - Is this the future of schools under the LEARNS Act? This looks like the resegregation of schools.
Exalt Academy - They almost exclusively serve minority students. I am curious how their test scores will compare to Founders.
Looking at the test data for the charter schools
In order to test my hypothesis to see if the decrease in LRSD’s enrollment numbers was due to “brain drain”, I had to look at the literacy scores for the charter schools over the same time period. If this hypothesis is correct, I should see test scores increase substantially at the charter schools in Little Rock. I made a graph for each of the four charter schools as I did previously.


eStem, Lisa, and Founders all experienced similar declines in scores as did LRSD. The large swings from year to year seen with Founders and Exalt are for subpopulations with very few students in those populations, so keep that in mind when you see the ups and downs for those.
The fascinating example here is Exalt Academy though. Of the four charter schools I looked at, this was the only school to show growth during this time period. They nearly doubled the percentage of students who meet or exceed standards. I am curious to see how their next standardized test scores compare and if they continue to show growth.
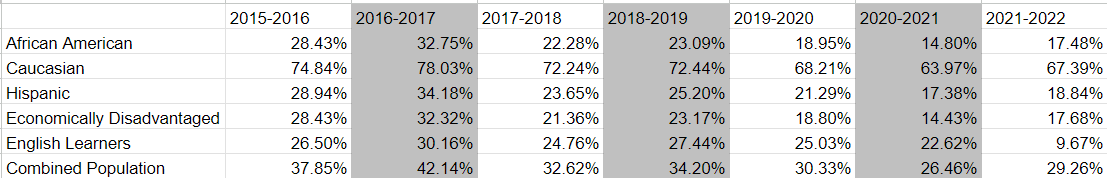
To more easily compare Little Rock Schools with the charter schools, I used the combined scores for each to make the following graph.
Comparing these charter schools to LRSD, it becomes very clear that the drop in LRSD’s test scores cannot be attributed to students leaving the public school to attend the charter schools in the city. In general, it appears there might be some greater societal pressures in play since the shapes of the curves are shaped similarly.
Something had to account for the changes in test scores though and I figured there might be other data from the Arkansas Department of Education that might lead me to the answer.
Looking at the low-income levels of the schools in Little Rock
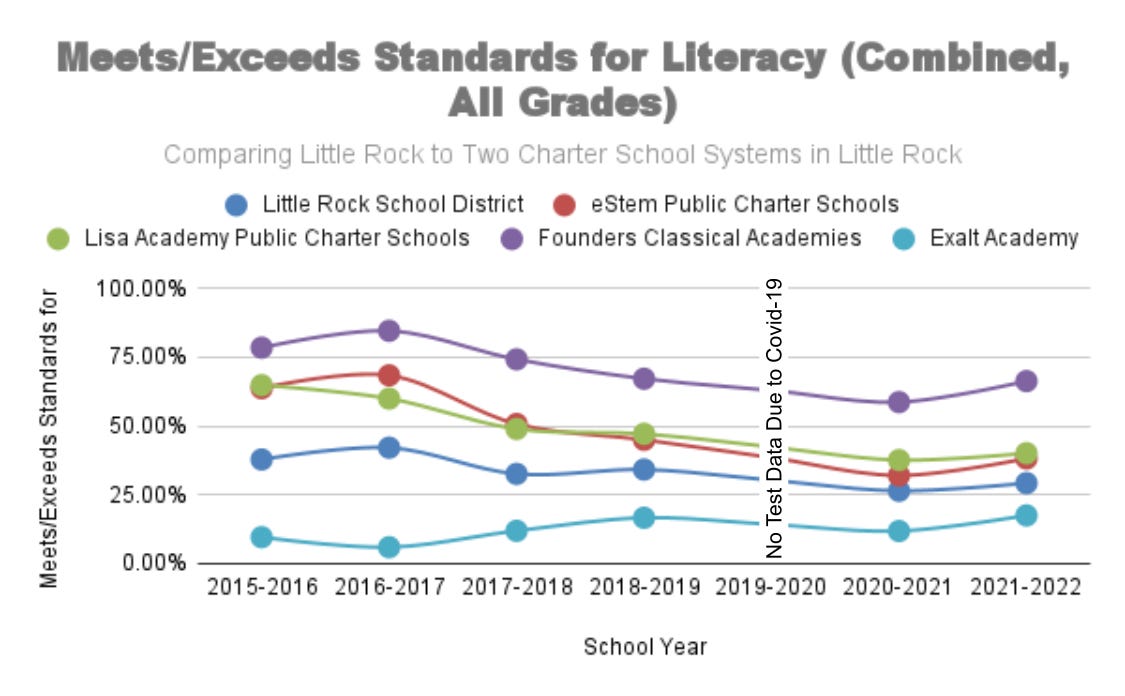
After considering other metrics I could look at as possible causes for the drop in test scores, I settled on the idea of checking the poverty level at the various schools. This is something that ADE keeps track of in the form of the free and reduced lunch participation rates (FRL) at every traditional public and charter school in the state. This number is often used by researchers as a proxy for childhood poverty, though they realize it is far from perfect. It is an easily accessible number I can use to run some analysis though, so I pulled the data from the same ADE database I used earlier.
A few observations from the data:
LRSD - The FRL rate fluctuates between 70-75% each year, but otherwise appears relatively flat.
eStem/Lisa - Both experienced significant increases in their FRL rate and by the end of 2022, both were very similar to LRSD’s FRL rate.
Founders - Their FRL rate is extremely low. This indicates the students at this charter school are middle to upper-class. Remember that the majority of students here are Caucasian or Asian.
Exalt - Their FRL rate for them is almost the exact opposite of Founders Classical Academy. Remember that the majority of students are black or Hispanic.
Given that the trends of the FRL rates for eStem and Lisa Academy are increasing over time, this was the exact opposite of what happened with their test scores. This caused me to wonder if there is an inverse correlation between the decrease in their test scores and an increase in their FRL rates. Since the other charter schools’ rates seemed relatively flat but polar opposites of each other and knowing they serve two drastically different populations of students, I knew I needed to see if there was a mathematically significant correlation between income levels and test scores. So I wondered, could income levels predict student test scores on standardized tests?
My hypothesis was that the socioeconomic conditions of a child impact their learning outcomes. This is something that educators know intuitively, but state governments seem to ignore. Most education reforms totally ignore this fact. The new LEARNS Act is no exception.
The connection between income and test scores
I first looked at LRSD. This graph looks at the relationship between the FRL rate and the meets/exceeds rate, with FRL on the x-axis as the independent variable and the meets/exceeds rate on the y-axis as the dependent variable. This means that a change in the FRL rate will directly change the meets/exceeds rate. At least, that was my hypothesis.
The best-fit line between the six data points is almost perfectly flat. It seems there is no real connection between FRL and standardized test scores. Notice there is an r-squared value of 0.001, which seems to confirm there is no relationship between the two variables.
If you need a simple explanation of what an r-squared value means, it is how much of the independent variable (FRL) causes a change in the dependent variable (meet/exceed). A value close to 1.0 shows a strong correlation, while a value close to 0.0 shows no correlation. For a more detailed (but still easy-to-understand) explanation of r-squared, you can read this article.

Based on the r-squared value, it seemed I should reject my hypothesis, but a low value does not always mean no relationship exists. It could just be the case we do not have enough data points. I was not deterred yet though, because I saw the strong trend for two of the charter schools. So I then proceeded to graph the same data for the charter schools in Little Rock.


eStem and Lisa Academy show a strong negative correlation between FRL and meet/exceed rates, with 0.85 and 0.935 respectively. A negative correlation means as FRL increases, meets/exceeds decreases, and vice versa. As one goes down, the other goes up.
I could not believe how strongly FRL correlated to the test scores for these two charter schools! I suspected the value would be high, but I never anticipated the r-squared value to be THIS high! A quick interpretation of these values means FRL rates can account for 85-93.5% of the students’ standardized test scores at these two schools. This is especially telling when taken since enrollment increased for these two schools and they both saw significant increases in the number of low-income students during this time period.
The other two charter schools showed weak negative correlations between FRL and meet/exceed rates. Looking at the data for the four charter schools proved enlightening and helped me answer the question, “What do standardized test scores actually measure?” The short answer: poverty (or the socioeconomic status of a student).
However, I wanted to see if my hypothesis held true outside of Little Rock. Remember, not all the data indicated a strong negative relationship existed between FRL and meet/exceed rates for standardized test scores. Data from LRSD seemed to indicate there was no relationship, but was that actually the case? I would need more data if I were to find the answer to this question.
Looking at a representative sample of the state
While I firmly believed my data from eStem and Lisa Academies definitively proved the strong correlation between FRL and standardized test scores, I wanted to check more data from more districts across the state. I would have preferred to test it against all the schools in the state, but the way I know to get the data I needed from ADE’s data website, limited me to just a handful of districts at a time. As a result, I chose to look at the data from 20 different districts.
I divided the schools in the state into five different groups based on their 2022 FRL rates. I wanted to ensure I had a representative sample from schools at 100% FRL down to near 0% FRL. I chose four random districts from each group and looked at the FRL and testing data for the last six years.

After I performed the analysis with this new data, I was certain of the answer to the question I posed in the title of this article. Look at the strong negative correlation between FRL and standardized test scores. The r-squared of 0.829 indicates that 82.9% of a student’s standardized test score can be accounted for by the free and reduced lunch status of the student.
The answer to the question posed in the title of this article is that a student’s socioeconomic status can reliably be used to predict a student’s standardized test performance. In other words, poor students perform poorly on standardized tests while affluent students perform well. Standardized tests measure the socioeconomic status of students. This does not mean it is true for every individual student. This is looking at it in terms of entire groups of students.
If you were curious, I am not the first person to come to these same conclusions. A quick Google search can yield several other articles and studies if you are interested. Here is one example that will provide you with additional insight.
How does all of this relate back to the new LEARNS Act and the Marvell-Elaine School District?
The Marvell-Elaine School District does not need to be punished, nor do its students need to be penalized just because they are low-income. Poverty is difficult to overcome, but if we really want to fix educational outcomes for students, we really need to fix poverty. LEARNS does not address the root cause of poor standardized test scores, which is poverty.
If you were curious to see how Marvell-Elaine’s students’ data looks, they are between 97-100% FRL, have historically scored very low on standardized tests, and are majority black.


Instead of offering these students and the district the support they need to begin overcoming the ill effects of poverty, the state has chosen to hand them off to the Friendship Education Foundation with a transformation contract. The sure way to improve the standardized test scores is to fix poverty, but putting Marvell-Elaine under Friendship’s control is no guarantee of success given that we lack the data to verify their long-term success. Their schools in Arkansas have not been around long enough yet.
Vouchers for private schools are not the answer either
By and large, private schools serve more affluent students. Giving a poor student a voucher to attend a private school does not magically cure the student of the ill effects of poverty. A parent may believe that the private school will work miracles for their child based on the perception that their test scores are better. Private schools generally show higher scores on standardized tests than the local public schools because they service more affluent students than the local public school, not because the school is necessarily better.
Without private schools being required to report the same data and use the same standardized tests as public schools, it will never be possible to accurately compare the two to see if private schools actually outperform public schools. Under LEARNS, private schools can select if which students they admit and can dismiss them for poor academic performance. If private schools really are better equipped to help the most disadvantaged students, why are they given the ability to remove students for struggling academically? And remember, the data shows poor students are significantly more likely to struggle than affluent students.
Remedy the early childhood achievement gap to begin making a difference
One thing that LEARNS fails to do is improve access to early childhood education, which is one of the best ways to begin remedying the effects of poverty. We need to address the early childhood achievement gap, which often results in poor students starting kindergarten one or more years behind their more affluent peers. As one researcher said though,
“Lower social-class parents are actually doing more to prepare their children for school than ever before, but their efforts are simply not enough to counteract the ill effects of poverty and inequality, which have worsened, even as parental efforts and whole-child policies have increased.”
To ignore the negative, long-term effects of poverty on the learning and achievement levels of students is educational malpractice. LEARNS doubles down on utilizing standardized test scores to make harsh judgments on schools and students. Schools can be forced into transformation contracts for low test scores, but test scores are really just expensive ways to measure the socioeconomic status of students. Students can be forced to repeat 3rd grade for being behind in reading as measured by a single test at a single point in time, which considering that these poor students already are starting kindergarten 1-3 years behind their affluent peers, adversely penalizes the poor for being poor.
What else can be done?
With such a high correlation between FRL and standardized test scores, the best-fit line can even be used as a baseline for determining how well a school is performing despite the socioeconomic status of students. The established baseline can be used to identify the districts and schools that are actually overcoming the ill effects of low socioeconomic conditions.
These districts and schools should be carefully studied to see what they are doing differently than their peers who serve similar student populations of similar socioeconomic status. A strategy that works in a school of similar size with similar students will have a better chance of success. Using a strategy that works in Bentonville may not work well in a district like Marvell-Elaine. However, if we use the data to find another school in South Arkansas with a poor, high minority population that is performing one or more standard deviations away from the norm better than Marvell-Elaine, that kind of strategy will have a much higher chance of success.
Conclusion
The reason this article was so long is that I wanted to model my thought process as I searched for an answer. As a teacher, I try to help my students understand how to find answers to their own questions. It is a valuable skill to learn.
In my pursuit for an answer, one question led to another question until I arrived at the question used in the title. What do standardized tests actually measure? They measure the socioeconomic status of students. Therefore, using standardized test scores as a way to penalize students or punish school districts is unjust. I am not claiming standardized tests cannot provide any valuable information or that they do not indicate other things like what a student has learned. However, I am warning against using those tests to make harsh decisions like retaining students or handing taking local control of schools away from the communities where the schools exist.
These are just some of the reasons I oppose the LEARNS Act. Over the coming days and weeks, I will share more information similar to this article. I doubt many others will be this long.
If you made it this far, I appreciate you taking the time to read this article. I tried to provide links to aid in your further research on the topic. If you have any questions or if I need to further clarify something, reach out to me in the comments, or better yet, try to find the answer yourself through research.
Ask questions. Search for answers. Stay curious!
For more information about Citizens of Arkansas for Public Education and Students (CAPES) and the referendum petition they are trying to get on the ballot in 2024, visit their website at http://www.saynotolearns.org. With enough signatures on the ballot by the end of July 2023, it will give voters in Arkansas a chance to decide the future of education in the state. The majority of teachers in the state oppose LEARNS. I think you owe it to yourself to understand why.
If you found this article to be beneficial, consider clicking on the subscribe button below to be notified the next time I write a post.
As you wrote, teachers intuitively know that poverty affects learning and test scores—probably more than anything else. Unfortunately, so few of the resources we are given actually help us battle that specific obstacle. I hope your shining another light on it with this research will get the attention of people who can, and will, do something to assist us rather than give us one more bandaid that does nothing but cover up the gaping hole. And cover it poorly.
Ok … let’s say it had gotten ‘worse’ under Republican control. If it did. Where did we move to under Democrats? 46? 45? 44? The goalposts did not move significantly did they?
Both have failed.
I stand by my comment. It’s odd… you guys are usually all about bold change. I guess it’s only if it’s your bold change.